Back to Labs Content
- Distributed Systems
- Deployment
- Microservices
- DevOps
From Kubernetes Overload to Observability: How the Sidecar Pattern in Service Mesh Saves the Day
Saturday, June 7, 2025 at 9:17:06 PM GMT+8
Modern applications are often built using a microservices architecture, where an app is broken into smaller, independent pieces—like a user-service for handling user data and a payment-service for processing transactions. Kubernetes, a popular tool, helps manage these pieces by running them in containers and ensuring they’re available and scalable. But as your application grows, Kubernetes alone can’t handle everything. Let’s break this down and see how the sidecar pattern in a service mesh comes to the rescue, making your system easier to monitor, secure, and manage.
The Problem: Kubernetes Isn’t Enough
Imagine you’re running a busy online store. You have two key services in your Kubernetes cluster:
1. user-service: Manages user profiles, logins, and preferences.
2. payment-service: Handles payments and transactions.
These services talk to each other constantly, especially when traffic spikes (think Black Friday sales). Kubernetes does a great job of:
1. Scheduling containers to run on available machines (nodes).
2. Checking if containers are healthy.
3. Scaling up by adding more containers when needed.
But here’s where it falls short:
1. No Built-In Observability: Kubernetes doesn’t automatically show you how services talk to each other—how many requests succeed, fail, or take too long.
2. No Service-to-Service Security: It doesn’t encrypt communication between services (e.g., user-service to payment-service) by default, leaving data vulnerable.
3. Manual Fixes for Network Issues: If a service fails, you have to code your own logic for retries (trying again), circuit breaking (stopping requests to a failing service), or rate limiting (controlling traffic volume).
4. Debugging Is Hard: When payment-service slows down or crashes, figuring out why—especially across multiple machines—is a nightmare.
As you add more services, these problems get worse. You need a way to handle these issues without rewriting your application code every time.
The Rescue: Sidecar Pattern in Service Mesh
A service mesh is like a superhero layer for your Kubernetes cluster. It’s a system that manages how services communicate, taking the burden off your application code. The key player here is the sidecar pattern, where a small helper program—a sidecar proxy (like Envoy)—is added to each service.
What’s a Sidecar?
Think of a motorcycle with a sidecar: the motorcycle is your app (e.g., user-service), and the sidecar is a buddy attached to it, handling extra tasks. In Kubernetes, each pod (a small unit in Kubernetes) contains:
1. Your app container (e.g., user-service).
2. A sidecar proxy container (e.g., Envoy).
All network traffic—requests going in and out of your service—flows through the sidecar proxy. This little helper takes over the tricky stuff, so your app can focus on its core job (like processing payments).
What the Sidecar Proxy Does
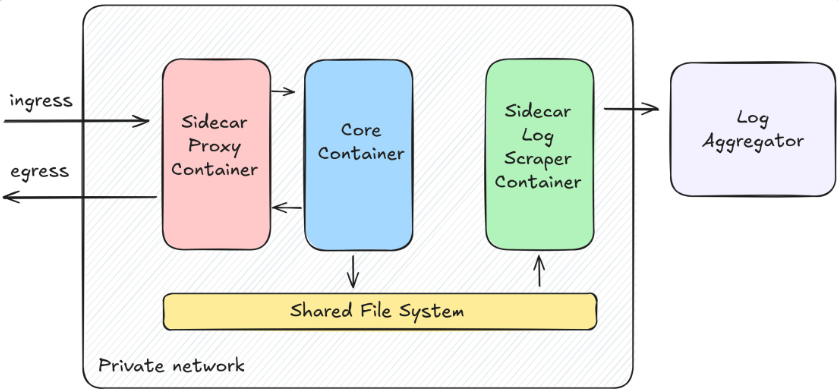
The Sidecar Proxy Container acts as the traffic manager for the Core Container. Here’s how it handles the key functions based on the diagram:
1. Observability:
- The Sidecar Proxy Container monitors all ingress (incoming) and egress (outgoing) traffic. It collects data like request counts, response times, and error rates.
- While the diagram doesn’t show direct metric or trace outputs (e.g., to Prometheus or Jaeger), the proxy’s control over traffic implies it can gather this data and send it to observability tools, enhancing visibility into the Core Container’s performance.
2. Security:
- All traffic passes through the Sidecar Proxy Container, allowing it to enforce mTLS (mutual Transport Layer Security) to encrypt communication between services. This ensures that data moving in and out (via ingress and egress) is secure, protecting the Core Container from unauthorized access.
3. Traffic Control:
- The proxy manages retries, timeouts, and circuit breakers. For example, if the Core Container fails to respond to an ingress request, the proxy can retry the request or break the circuit to prevent overload.
- It routes traffic efficiently, acting as the entry and exit point, which simplifies handling high loads or failures.
Role of the Sidecar Log Scraper Container
The Sidecar Log Scraper Container complements the proxy by focusing on logging:
- It scrapes logs generated by the Core Container and stores them in the Shared File System.
- The Log Aggregator then pulls these logs from the Shared File System for centralized analysis. This setup enhances observability by providing detailed logs alongside the proxy’s traffic data, which can be used for debugging or auditing.
How It Works Together
- Traffic Flow: External requests (ingress) enter through the Sidecar Proxy Container, which processes them (e.g., applies security, controls traffic) before passing them to the Core Container. Responses (egress) follow the reverse path.
- Log Management: The Sidecar Log Scraper Container continuously collects logs from the Core Container, saving them to the Shared File System. The Log Aggregator retrieves and aggregates these logs, making them available for tools like Elasticsearch or a monitoring dashboard.
- Collaboration: The Shared File System acts as a common storage layer, enabling the sidecars to share data (e.g., logs) without direct communication, keeping the architecture lightweight.
This setup means the Core Container can focus on its primary task (e.g., processing user data) while the sidecars handle networking and logging. The Sidecar Proxy Container ensures secure, observable, and controlled traffic, while the Sidecar Log Scraper Container provides a robust logging pipeline. Together, they transform a simple container into a well-monitored, secure, and manageable service, aligning with the service mesh’s goals of reducing operational complexity.
How It Works Internally
Here’s the big picture:
1. You install a service mesh tool like Istio (or another option, Linkerd) on your Kubernetes cluster.
2. You tell Istio to add a sidecar proxy (Envoy) to each pod automatically.
3. You deploy your services (user-service, payment-service) as usual.
4. All traffic—incoming and outgoing—goes through the Envoy proxy.
5. Envoy collects data and sends it to tools like Prometheus (Stores and shows metrics e.g: request volume, error rates) and Jaeger (Tracks the journey of each request across services)
Suddenly, your cluster becomes:
- Observable: You can see what’s happening.
- Secure: Traffic is encrypted.
- Resilient: Failures are handled smoothly.
Hands-On: Step-by-Step Implementation
Let’s walk through setting this up in a simple, practical way. We’ll use Istio, a popular service mesh, and add observability tools.
et’s dive into setting up a service mesh with Istio on your Kubernetes cluster to implement the sidecar pattern. This hands-on guide provides a detailed, step-by-step process to get your microservices (like user-service and payment-service) running with observability, security, and traffic management. We’ll use Istio, a popular service mesh, along with its built-in observability tools (Prometheus, Jaeger, and Kiali). This assumes you have a working Kubernetes cluster (e.g., Minikube for local testing) and basic command-line knowledge.
1. Install Istio with Observability Tools
Istio acts as the control plane for your service mesh, managing sidecar proxies and providing observability features. Here’s how to install it with a demo profile, which includes pre-configured tools like Prometheus (metrics), Jaeger (tracing), and Kiali (visualization).
- Run the following command to fetch the latest Istio release
Download Istio
curl -L https://istio.io/downloadIstio | sh -
This downloads a tarball and extracts it. Navigate to the extracted directory:
cd istio-*
Install Istio:
- Use the istioctl command-line tool to install Istio with the demo profile, which includes all observability add-ons:
bin/istioctl install --set profile=demo -y
The --set profile=demo flag enables a lightweight setup with Prometheus, Jaeger, Kiali, and Grafana for testing. The -y flag auto-confirms the installation.
- Verify the installation by checking the Istio pods:
kubectl get pods -n istio-system
You should see pods like istiod, prometheus, jaeger, and kiali running. If they’re not all “Running,” wait a moment and check again.
This step sets up the control plane and observability stack, preparing your cluster for sidecar injection.
2. Prepare Your Namespace
Namespaces in Kubernetes help organize resources. To enable automatic sidecar proxy injection (using Istio’s sidecar injector webhook), you need to label a namespace.
Create a Namespace
- Create a namespace called demo for your microservices:
kubectl create namespace demo
Enable Sidecar Injection
- Label the namespace to tell Istio to automatically inject the Envoy sidecar proxy into every pod deployed in it:
kubectl label namespace demo istio-injection=enabled
- Verify the label:
kubectl get namespace demo --show-labels
Look for istio-injection=enabled in the output. This ensures that when you deploy your services, Istio adds the sidecar proxy automatically.
This step isolates your experiment and prepares the environment for sidecar-enabled pods.
3. Deploy Microservices
Now, deploy your microservices (e.g., user-service and payment-service) into the demo namespace. Istio will inject the sidecar proxy into each pod.
Define Service Configurations:
- Create two YAML files to define your services. Here’s an example for user-service.yaml:
apiVersion: v1
kind: Service
metadata:
  name: user-service
  namespace: demo
spec:
  ports:
  - port: 8080
    targetPort: 8080
  selector:
    app: user-service
---
apiVersion: apps/v1
kind: Deployment
metadata:
  name: user-service
  namespace: demo
spec:
  replicas: 1
  selector:
    matchLabels:
      app: user-service
  template:
    metadata:
      labels:
        app: user-service
    spec:
      containers:
      - name: user-service
        image: hashicorp/http-echo:0.1
        args:
        - "-text=Hello from User Service"
        ports:
        - containerPort: 8080
- Create payment-service.yaml similarly, changing the name and text (e.g., "Hello from Payment Service").
- These files define a simple service using a demo image (http-echo) that responds with a message.
Deploy the Services:
- Apply the configurations:
kubectl apply -f user-service.yaml
kubectl apply -f payment-service.yaml
- Check the pods to confirm sidecar injection:
kubectl get pods -n demo
Each pod should have two containers: your app (e.g., user-service) and the Istio proxy (e.g., istio-proxy). If you see only one, ensure the namespace label is correct.
This step deploys your services with Envoy sidecars, enabling service mesh features.
4. Expose Services via Istio Gateway
To make your services accessible from outside the cluster, use an Istio Gateway and Virtual Service to route traffic.
Create Gateway
- Create a file gateway.yaml:
apiVersion: networking.istio.io/v1alpha3
kind: Gateway
metadata:
  name: demo-gateway
  namespace: demo
spec:
  selector:
    istio: ingressgateway
  servers:
  - port:
      number: 80
      name: http
      protocol: HTTP
    hosts:
    - "*"
- Apply it:
kubectl apply -f gateway.yaml
Create Virtual Services
- Create virtual-service.yaml to route traffic
apiVersion: networking.istio.io/v1alpha3
kind: VirtualService
metadata:
  name: demo-vs
  namespace: demo
spec:
  hosts:
  - "*"
  gateways:
  - demo-gateway
  http:
  - match:
    - uri:
        prefix: /user
    route:
    - destination:
        host: user-service
        port:
          number: 8080
  - match:
    - uri:
        prefix: /payment
    route:
    - destination:
        host: payment-service
        port:
          number: 8080
- Apply it:
kubectl apply -f virtual-service.yaml
The gateway and virtual service work together to route /user to user-service and /payment to payment-service.
5. Access Observability Tools
Istio’s observability tools let you monitor your services. Use port forwarding to access them locally.
Set Up Port Forwarding
- For Prometheus (metrics):
kubectl port-forward svc/prometheus -n istio-system 9090
- For Jaeger (tracing):
kubectl port-forward svc/jaeger-query -n istio-system 16686
- For Kiali (visualization):
kubectl port-forward svc/kiali -n istio-system 20001
Keep these terminals open to maintain the connections.
Access the Tools:
Open a browser and visit:
1. Prometheus: http://localhost:9090—View dashboards with request counts, latency, and errors.
2. Jaeger: http://localhost:16686—Trace requests across services.
3. Kiali: http://localhost:20001—See a graph of service interactions and traffic flow.
Explore the interfaces to understand your services’ behavior.
6. Simulate Traffic
Test your setup by generating traffic to see the sidecar and observability in action.
Get the Gateway URL:
- If using Minikube, find the ingress gateway URL:
export GATEWAY_URL=$(minikube service istio-ingressgateway -n istio-system --url)
This gives you a URL like http://192.168.49.2:port.
Send Test Requests:
- Use curl to simulate traffic:
curl $GATEWAY_URL/user
curl $GATEWAY_URL/payment
You should see responses like "Hello from User Service" and "Hello from Payment Service."
Check Observability:
Refresh Prometheus, Jaeger, and Kiali. You’ll see metrics, traces, and a traffic graph updating as requests flow through the sidecars.
This step confirms your setup works, with sidecars managing traffic and observability tools providing insights.
Conclusion
Kubernetes gives you strong container orchestration, but not observability, security, or advanced traffic handling. The sidecar pattern in service mesh brings those features with minimal disruption to your services.
By installing Istio and using sidecars, you gain:
- Metrics (via Prometheus)
- Tracing (via Jaeger)
- Visual traffic graphs (via Kiali)
- mTLS, retries, timeouts, and more
Now, instead of fighting blind during service outages, you can trace, analyze, and debug with clarity.
Modern systems demand more than deployments. They demand insight. Service Mesh is the bridge
Another Recommended Labs Content
How to Stop Microservices Failures from Spreading with the Bulkhead Pattern
Microservices are awesome for building apps that scale and evolve quickly. But as your system grows, a small problem in one service can snowball into a disaster, taking down your entire application. This is called a cascading failure, and it’s a big challenge in microservices. The Bulkhead Pattern is a smart way to prevent this by isolating parts of your system so one failure doesn’t sink everything else.
In today's infrastructure management landscape, efficiency, speed, and consistency are essential. One of the most popular and flexible configuration automation tools available today is Ansible. This article explores the urgency of using Ansible, its definition, how it works, and provides a practical tutorial to get you started quickly.
In modern software architecture, microservices have become the go-to approach for building scalable, maintainable, and independently deployable applications. However, with great modularity comes great complexity—especially when it comes to managing data consistency across services.